
What Is a Candlestick Wick? | ZenithFX
Understanding the Basics of Candlestick Charts
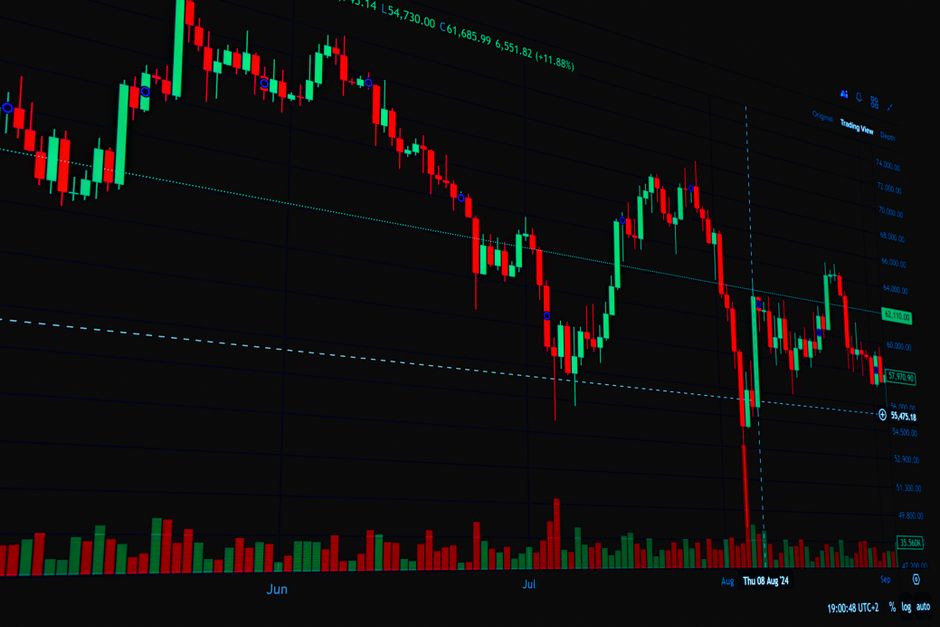
If you have ever looked at a forex price chart, you have almost certainly seen candlestick charts. They are the most popular way to read price movements in trading, and for good reason. Each candle on the chart tells a clear visual story about what buyers and sellers did during a specific period of time. To read that story properly, you need to understand every part of a candle — including the often-overlooked but incredibly important candlestick wick.
Many beginner traders focus almost entirely on the body of the candle, which shows the opening and closing price. However, the wicks — those thin lines extending above and below the body — carry just as much useful information. Learning to read wicks correctly can genuinely improve how you interpret price action and make trading decisions.
What Exactly Is a Candlestick Wick?
A candlestick wick, also called a shadow or tail, is the thin vertical line that extends beyond the body of a candle. Every candle can have an upper wick, a lower wick, both, or neither. The upper wick extends upward from the top of the candle body, while the lower wick extends downward from the bottom of the body.
The tip of the upper wick marks the highest price reached during that candle’s time period. The tip of the lower wick marks the lowest price reached. So if you are looking at a one-hour candle, the wicks show you the full price range traded during that hour, beyond where the price eventually opened and closed.
For example, imagine a one-hour candle that opened at 1.1000 and closed at 1.1050. The candle body represents that 50-pip move. But if the upper wick reaches 1.1080, it means the price actually pushed as high as 1.1080 during the hour before falling back down to close at 1.1050. That extra information is what makes wicks so valuable.
What Do Wicks Tell You About Market Behavior?
Wicks reveal the battle between buyers and sellers during a given period. A long upper wick, for instance, shows that buyers pushed the price significantly higher at some point, but sellers stepped in with enough force to drive the price back down before the candle closed. This can be a sign that sellers are becoming stronger, or that the market hit a level of resistance where selling pressure increased.
A long lower wick tells the opposite story. Sellers pushed the price down sharply, but buyers came in and pushed it back up before the candle closed. This can suggest that buyers are defending a certain price level, or that the market found support in that area. The longer the wick, the more dramatic that rejection was.
Short wicks, on the other hand, suggest that the price moved in one direction with relatively little pushback. A candle with a large body and very short wicks often indicates strong momentum in the direction of the move, with one side clearly dominating during that period.
Common Wick Patterns Traders Watch For
Certain candlestick patterns are defined almost entirely by their wicks, and traders use these patterns as signals to watch for potential price reversals or continuations. It is important to note that no pattern guarantees a specific outcome — they simply offer clues about what might happen next based on market behavior.
Some of the most well-known wick-based patterns include:
- Pin Bar (Pinocchio Bar): A candle with a very long wick on one side and a small body on the other. A bullish pin bar has a long lower wick, suggesting buyers rejected lower prices. A bearish pin bar has a long upper wick, suggesting sellers rejected higher prices.
- Hammer: A candle with a small body near the top and a long lower wick. It typically appears after a downtrend and can signal a potential reversal upward.
- Shooting Star: The opposite of a hammer — a small body near the bottom and a long upper wick. It often appears after an uptrend and can suggest a potential reversal downward.
- Doji: A candle where the opening and closing prices are nearly the same, leaving almost no body. The wicks on both sides reflect indecision in the market, with neither buyers nor sellers taking clear control.
Learning to spot these patterns is a foundational skill in technical analysis. Platforms like ZenithFX.com provide clean, easy-to-read candlestick charts where you can practice identifying these formations across different currency pairs and timeframes.
How Wicks Relate to Support and Resistance
One of the most practical ways to use wick analysis is in identifying support and resistance levels. When you see multiple candles forming long wicks at a similar price level, it often means the market has repeatedly rejected that level. The tips of those wicks cluster together to highlight a zone where price activity becomes contested.
If the price keeps touching a level with long upper wicks and then falling back, that price area is acting as resistance — a ceiling that buyers cannot seem to break through. If lower wicks repeatedly form at the same price area, that level is acting as support — a floor that sellers cannot push through. These wick clusters can be powerful reference points when planning potential trade entries or exits.
Combining wick analysis with support and resistance is a simple but effective approach to reading charts. Rather than looking at wicks in isolation, consider the broader context. A single pin bar means less than a pin bar that forms right at a well-established resistance level, for example.
Common Mistakes Beginners Make With Wicks
One of the most common mistakes is treating every long wick as an immediate signal to enter a trade. Wicks need context. A long lower wick in the middle of a ranging market carries very different weight than one that forms right at a key support level after a sustained downtrend. Always consider where the wick appears on the chart, not just what it looks like.
Another mistake is ignoring wicks altogether and only focusing on candle bodies. The body shows you where the price settled, but the wick shows you where the price tried to go. Both pieces of information together give you a much more complete picture of market sentiment and the forces at work during that period.
Finally, beginners sometimes forget to consider the timeframe they are trading on. A long wick on a one-minute chart carries far less significance than the same pattern on a daily chart. Higher timeframes generally reflect more meaningful market activity because they capture the decisions of a much larger number of participants over a longer period.
Start Reading Wicks With a Free Demo Account
Candlestick wicks are one of the simplest yet most revealing tools available to forex traders. They cut through the noise and show you, in plain visual terms, where price was rejected and where momentum stalled. Once you develop the habit of reading wicks alongside candle bodies and key price levels, your chart analysis will become noticeably sharper.
The best way to build this skill is through consistent practice. Open a free demo account at ZenithFX.com and spend time observing how wicks form in real market conditions across different currency pairs. A demo account lets you apply what you have learned without risking real money, making it the ideal environment to build confidence and develop your eye for price action. Start today and take your first steps toward reading charts like an experienced trader.
🎓 Free Forex Education at ZenithFX
Access our full learning center — forex basics, advanced strategies, video tutorials, and live webinars. All completely free.
Leave a comment