
What Is a Candlestick Body? | ZenithFX
Understanding the Basics of Candlestick Charts
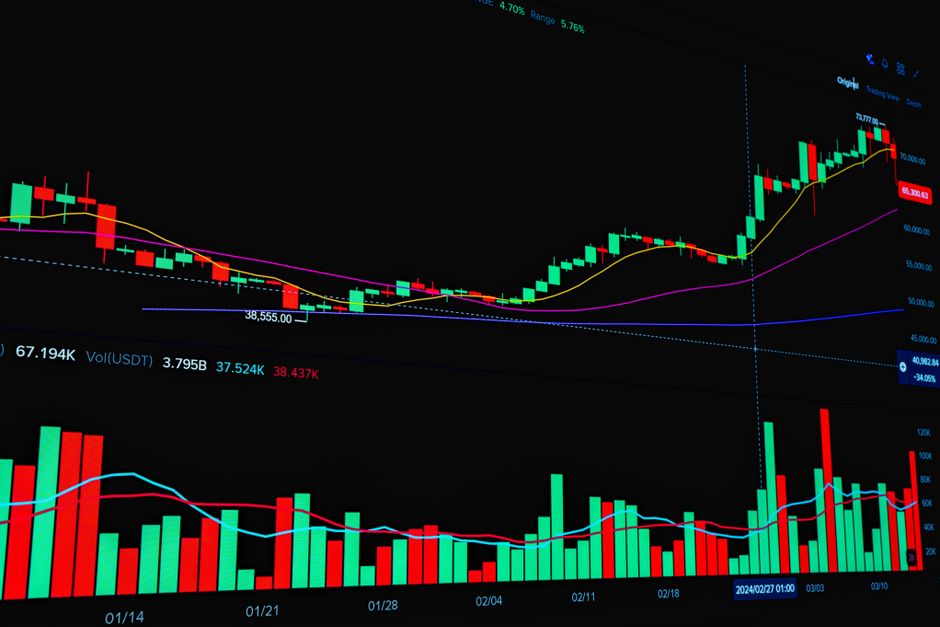
If you have ever looked at a forex price chart, you have almost certainly seen candlestick charts. They are the most widely used charting style among traders around the world, and for good reason. Each candle on the chart tells a story about price movement during a specific period of time — whether that is one minute, one hour, or one day. To read that story correctly, you first need to understand the most important part of every candle: the body. Once you grasp what the candlestick body represents, the entire chart begins to make much more sense.
This guide breaks down exactly what a candlestick body is, what it tells you about the market, and how you can use that information to make more informed trading decisions. Whether you are completely new to trading or brushing up on the fundamentals, this is knowledge worth having firmly in place before you risk a single dollar in the markets.
What Is a Candlestick Body?
A candlestick body is the thick, rectangular section in the middle of a candlestick. It represents the difference between the opening price and the closing price of an asset during a given time period. If you are looking at a one-hour chart, for example, each candle shows you where price opened at the start of that hour and where it closed at the end of it. The body is the visual space between those two price levels.
The size of the body matters a great deal. A large body means there was a significant difference between the open and close, indicating strong buying or selling pressure during that period. A small body means the open and close prices were very close together, suggesting that neither buyers nor sellers were in clear control. Learning to read body size at a glance is one of the first practical skills you will develop as a chart reader.
The body does not show you the full range of price movement during a candle. That is the job of the wicks, also called shadows or tails, which extend above and below the body. The wicks show the highest and lowest prices reached, while the body focuses purely on where price started and where it ended up.
Bullish Bodies vs. Bearish Bodies
Candlestick bodies are color-coded to tell you instantly whether the price moved up or down during that period. A bullish candle — often shown in green or white — means the closing price was higher than the opening price. Price moved upward. A bearish candle — often shown in red or black — means the closing price was lower than the opening price. Price moved downward.
On a bullish candle, the bottom of the body represents the opening price and the top represents the closing price. On a bearish candle, it is the opposite: the top of the body is the opening price and the bottom is the closing price. This might seem a little confusing at first, but it becomes second nature very quickly once you spend time looking at live charts.
These color distinctions let you scan a chart quickly and get an immediate sense of market sentiment. A series of long green bodies suggests strong and sustained buying pressure. A series of long red bodies suggests sellers have been in control. Spotting these patterns across multiple candles is the beginning of reading market momentum.
What Body Size Tells You About the Market
Body size is one of the most useful pieces of information a candlestick can give you. A long body tells you that there was a decisive move in one direction during that time period. Buyers or sellers were motivated and pushed price significantly from the open to the close. This kind of candle often appears when important news is released, or when price breaks through a key level.
A short body, sometimes called a spinning top when combined with long wicks, tells you that the market was uncertain. Price moved back and forth during the period, but ultimately ended close to where it started. This kind of candle can signal a potential pause or reversal in a trend, especially if it appears after a long run in one direction.
A candle with almost no body at all is called a doji. On a doji, the open and close prices are virtually the same. This signals a standoff between buyers and sellers and is often interpreted as a warning sign that the current trend may be losing strength. Doji candles are closely watched by technical traders because of what they may signal about the next move.
Common Candlestick Patterns That Feature the Body
The body plays a central role in many well-known candlestick patterns that traders use to identify potential trade setups. The marubozu is one example — it is a candle with a very large body and little to no wick. A bullish marubozu shows that buyers dominated the entire session from open to close, with price never pulling back significantly. A bearish marubozu shows the opposite.
Another popular pattern is the engulfing pattern, which involves two candles. A bullish engulfing occurs when a large green candle’s body completely covers, or engulfs, the body of the previous red candle. This can signal a potential reversal from a downtrend to an uptrend. The bearish engulfing pattern works in the opposite direction. The body size comparison between the two candles is what makes the pattern meaningful.
- Marubozu: Large body with no wicks, signals strong directional momentum
- Doji: Almost no body, signals indecision between buyers and sellers
- Engulfing pattern: One candle’s body fully covers the previous candle’s body
- Spinning top: Small body with long wicks on both sides, signals uncertainty
- Hammer: Small body near the top of the candle with a long lower wick
These patterns are not guarantees of future price movement. No trading signal is. However, they are tools that help traders build a picture of what may be happening in the market and where opportunities might exist.
How to Use Candlestick Bodies in Your Trading
Understanding the candlestick body is most powerful when you combine it with other analysis tools. For example, watching how candle bodies behave near a support or resistance level can give you useful clues. If price approaches a resistance level and candle bodies begin to shrink, it may suggest that buying pressure is fading and sellers are stepping in.
You can also observe body size in relation to recent candles. If you see a sudden large-bodied candle after a period of small-bodied candles, it may signal a significant shift in momentum. Traders often look for this kind of change in character on the chart as a potential entry signal when combined with other confirming factors.
It is worth noting that candlestick analysis works on any time frame. Day traders might focus on five-minute or fifteen-minute charts, while swing traders may prefer four-hour or daily charts. The principles behind reading candle bodies remain the same regardless of the time frame you choose to trade on.
Start Practising Candlestick Reading Today
Reading candlestick bodies is a foundational skill that every forex trader benefits from developing. The good news is that it is not complicated. With a little practice, identifying bullish and bearish bodies, recognising body size, and spotting key candlestick patterns becomes fast and almost instinctive. The key word there is practice — and practice is best done in a risk-free environment before you trade with real money.
A demo account gives you access to live market conditions and real charts without putting your capital at risk. You can spend time watching how candle bodies form in real time, test how different patterns play out, and build genuine confidence in your chart-reading ability. This kind of hands-on experience is far more valuable than reading alone.
Open a free demo account at ZenithFX.com today and start applying what you have learned on real forex charts. There is no better way to build the skills that will serve you throughout your trading journey. Take that first step, explore the platform, and see how quickly your understanding of candlestick charts begins to grow.
🎓 Free Forex Education at ZenithFX
Access our full learning center — forex basics, advanced strategies, video tutorials, and live webinars. All completely free.
Leave a comment