
What Is a Candlestick Chart? | ZenithFX
Reading the Market One Candle at a Time
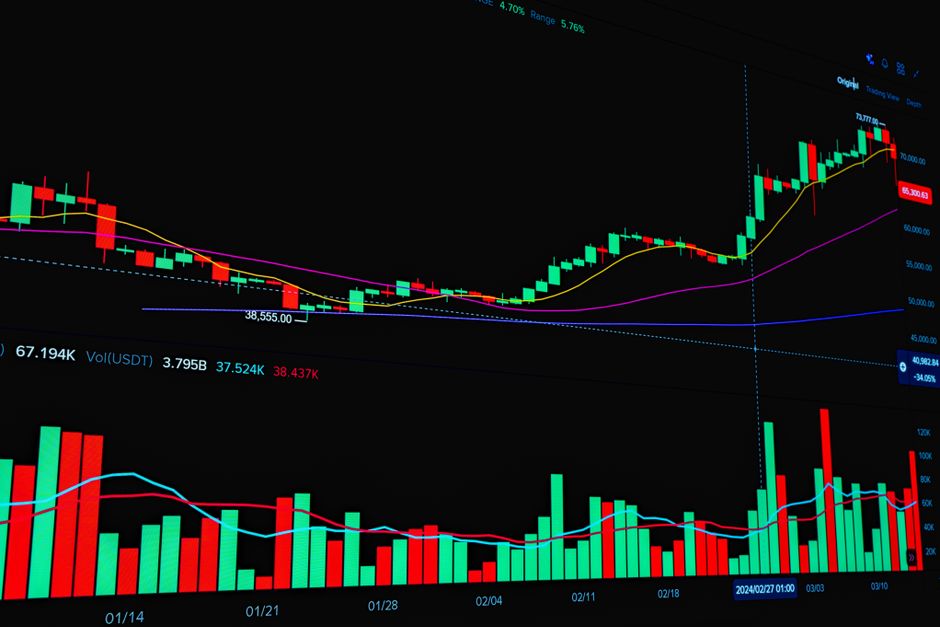
Every successful forex trader needs a reliable way to read price movements in the market. One of the most widely used tools for doing this is the candlestick chart. Whether you are completely new to trading or you have been watching charts for a while, understanding candlesticks is a foundational skill that will help you make more informed decisions. They give you a clear, visual snapshot of how a currency pair moved during any given period of time, all packed into a single, easy-to-read shape.
Candlestick charts originated in Japan centuries ago, where rice traders used them to track market prices and momentum. Today, they are the standard chart type used by professional forex traders around the world. Once you understand how to read them, you will start to see the story that price is telling you in real time.
The Anatomy of a Single Candlestick
Each candlestick represents price activity over a specific time frame. That time frame could be one minute, one hour, one day, or any other interval you choose. Inside that period, four key pieces of information are captured: the open price, the close price, the high price, and the low price. Together, these four data points form the shape of the candle.
The wide rectangular section in the middle is called the body. It shows the distance between the open and close prices. If the close price is higher than the open, the body is typically shown in green or white, indicating that buyers were in control and the price moved up. If the close is lower than the open, the body appears in red or black, showing that sellers dominated during that period.
The thin lines extending above and below the body are called wicks, or sometimes shadows. The upper wick shows the highest price reached during the time frame, while the lower wick shows the lowest. Long wicks can be very revealing. They often signal that the market tried to push in one direction but was rejected, which can be a useful clue about where price might move next.
How Candlestick Charts Differ From Other Chart Types
Before candlestick charts became popular in Western markets, traders commonly used line charts and bar charts. A line chart connects closing prices with a simple line. It is clean and easy to read, but it leaves out a lot of important information. You cannot see the open, high, or low price from a line chart, which limits what you can learn about market behavior.
A bar chart does include all four price points, shown through a vertical line with small horizontal dashes on each side. It carries the same information as a candlestick but many traders find candlesticks easier to interpret at a glance. The color-coded bodies make it much faster to spot whether buyers or sellers were winning during each period.
The visual clarity of candlestick charts is one of the main reasons they became the preferred choice for most retail and professional forex traders. When you are scanning multiple currency pairs quickly, being able to identify bullish and bearish candles instantly can make a real difference to your analysis speed and confidence.
Common Candlestick Patterns to Know
One of the reasons traders love candlestick charts is that certain formations appear again and again, and they often carry meaningful signals about what might happen next. These are called candlestick patterns, and learning to recognize them is a core part of technical analysis. It is important to understand, however, that no pattern guarantees a specific outcome. They are probability tools, not certainties.
Some of the most well-known single-candle patterns include:
- Doji — The open and close prices are nearly equal, creating a very small body. This suggests indecision in the market, where neither buyers nor sellers gained the upper hand.
- Hammer — A candle with a small body at the top and a long lower wick. It often appears after a downtrend and can suggest that buyers are starting to push back.
- Shooting Star — A candle with a small body at the bottom and a long upper wick. It frequently appears after an uptrend and may indicate that sellers are gaining strength.
- Marubozu — A candle with a large body and very little or no wicks, showing strong momentum in one direction.
Multi-candle patterns are equally important. The Engulfing pattern occurs when one candle’s body completely covers the previous candle’s body, often signaling a potential reversal. The Morning Star and Evening Star are three-candle patterns that traders watch for at the end of trends. Learning these patterns takes time and practice, which is why using a demo environment to study them in real market conditions is so valuable.
How to Use Candlestick Charts in Your Trading
Reading individual candles and patterns is just the starting point. Experienced traders use candlestick charts in combination with other tools to build a fuller picture of the market. Support and resistance levels are key reference points where price has previously reversed or stalled. When a candlestick pattern appears at one of these levels, many traders view it as a stronger signal than if the same pattern appeared in a random part of the chart.
Trading indicators such as moving averages, the Relative Strength Index (RSI), and Bollinger Bands can also be overlaid on a candlestick chart to add extra layers of context. For example, a bullish hammer candle appearing at a support level while the RSI is showing oversold conditions might attract more attention from a trader than a hammer appearing without those additional factors.
Time frame selection also matters. A candle on a daily chart represents an entire day of trading activity, while a candle on a five-minute chart shows just five minutes. Many traders look at multiple time frames together to get a broader view of the trend while also timing their entries more precisely on shorter charts. This multi-time-frame approach is widely practiced in professional forex trading.
Practicing Candlestick Analysis Without Risking Real Money
The best way to get comfortable with candlestick charts is simply to spend time watching them. You can start identifying patterns, noting where they appear, and observing what happens next. Over time, your eye will naturally become faster at reading what the market is communicating. This kind of repetition builds the pattern recognition skills that experienced traders rely on.
A demo trading account gives you access to real live charts and market data without putting any real capital at risk. You can explore different currency pairs, switch between time frames, and practice spotting candlestick patterns in actual market conditions. This hands-on experience is far more effective than only reading about concepts in theory.
Start Reading Markets With Confidence
Candlestick charts are one of the most powerful and accessible tools available to forex traders at any level. They transform raw price data into a visual language that, once learned, gives you a much richer understanding of what is happening in the market at any given moment. From the basic anatomy of a single candle to recognizing complex multi-candle patterns, each layer of knowledge you build adds to your overall trading toolkit.
The key is to start simple, stay consistent, and always remember that patterns are guides rather than guarantees. Markets are influenced by countless factors, and no chart reading technique removes risk entirely. What candlestick analysis does is help you weigh probabilities and approach your trades with greater structure and discipline.
Ready to put your new knowledge into practice? Open a free demo account at ZenithFX.com today and start exploring live candlestick charts with zero risk. Build your skills, test your ideas, and develop the confidence you need before ever trading with real money.
🎓 Free Forex Education at ZenithFX
Access our full learning center — forex basics, advanced strategies, video tutorials, and live webinars. All completely free.
Leave a comment