
How to Read Forex Charts | ZenithFX Guide
If you want to trade currencies, learning how to read forex charts is one of the most important skills you can develop. A forex chart is a visual representation of how one currency’s price moves against another over time. At first glance, these charts can look complicated and overwhelming. But once you understand the basic building blocks, they become powerful tools that help you make more informed trading decisions. This guide will walk you through everything you need to know to get started reading forex charts with confidence.
What Is a Forex Chart?
A forex chart displays the price history of a currency pair, such as EUR/USD or GBP/JPY. The horizontal axis shows time, while the vertical axis shows the price. As the market moves, the chart plots each price change, creating a visual record of how the pair has performed over a chosen period. This history helps traders identify patterns and trends that may influence future price movement.
Charts can be viewed across many different timeframes. A one-minute chart shows price changes minute by minute, while a daily chart shows one data point per day. Short-term traders often use lower timeframes like five or fifteen minutes, while longer-term traders prefer the four-hour or daily charts. Choosing the right timeframe depends on your trading style and how long you plan to hold your positions.
Most trading platforms, including ZenithFX.com, offer a full range of chart types and timeframes. Spending time exploring these options early on will help you find a setup that suits how you like to trade.
The Three Main Types of Forex Charts
There are three chart types you will encounter most often in forex trading. Each one presents the same price data in a slightly different way, and understanding the differences will help you choose the right tool for your analysis.
Line charts are the simplest type. They connect closing prices with a continuous line, giving you a clean, easy-to-read view of the overall trend. Line charts are useful for getting a quick picture of market direction, but they leave out a lot of detail about what happened during each period.
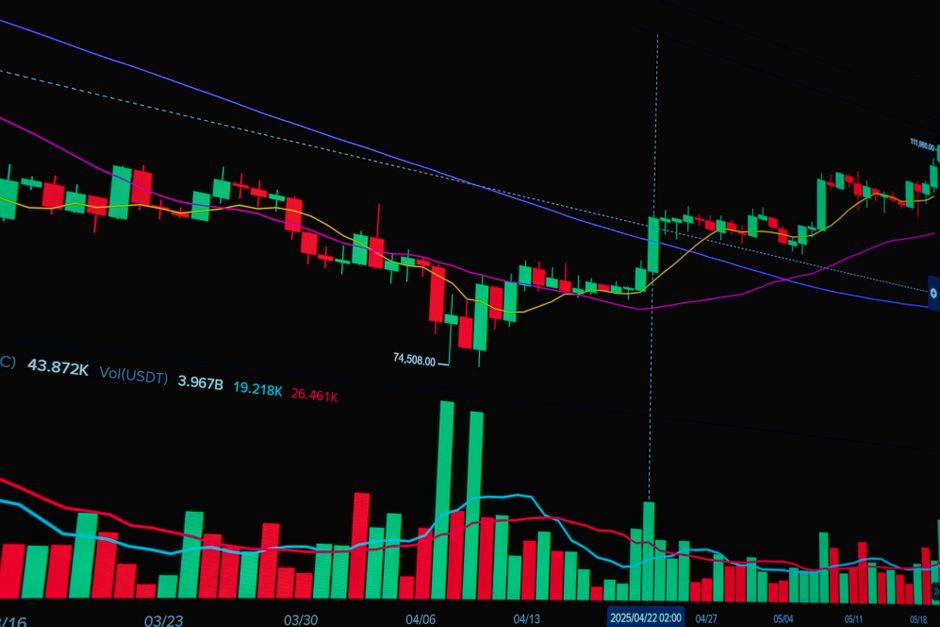
Bar charts provide more information. Each bar represents a single time period and shows four key prices: the open, the high, the low, and the close. A small horizontal tick on the left of the bar marks the opening price, and a tick on the right marks the closing price. The top and bottom of the bar show the highest and lowest prices reached during that period. Candlestick charts display the same four prices but in a format that many traders find easier to read. The body of the candle shows the range between the open and close, while the thin lines above and below, called wicks or shadows, show the high and low. If the close is higher than the open, the candle is typically shown in green or white, indicating a price increase. If the close is lower, the candle appears red or black.
Understanding Candlestick Charts in More Detail
Candlestick charts are by far the most popular chart type among forex traders, and for good reason. They pack a large amount of information into a compact visual format, making it easier to quickly assess market sentiment during any given period. Learning to read candlesticks is a skill that will serve you throughout your trading career.
A large green candle with a small wick suggests strong buying pressure during that period. A large red candle with a small wick points to strong selling pressure. When you see a candle with a very small body but long wicks on both sides, this is called a doji. A doji signals indecision in the market, where neither buyers nor sellers were able to take clear control.
Traders also look for specific candlestick patterns that can signal potential reversals or continuations in price. Common patterns include the hammer, the engulfing pattern, and the morning star. While no pattern guarantees a particular outcome, recognising these formations can help you build a more complete picture of what the market might do next.
How to Identify Trends on a Chart
One of the primary reasons traders analyse charts is to identify trends. A trend is simply the general direction in which a currency pair is moving over a given period. There are three types of trends you need to know:
- Uptrend: The price makes higher highs and higher lows over time, indicating that buyers are in control.
- Downtrend: The price makes lower highs and lower lows, showing that sellers are dominant.
- Sideways trend: The price moves within a relatively flat range, with no clear direction.
You can identify trends visually by looking at the overall shape of the price action on the chart. A useful tool for confirming trends is a trendline. To draw an uptrend line, connect two or more higher lows with a straight line. For a downtrend, connect two or more lower highs. When price consistently respects these lines, it reinforces the strength of the trend.
Understanding whether the market is trending or moving sideways is crucial because different trading strategies work better in different conditions. Trading with the trend is a common principle among experienced traders, as it means you are working with market momentum rather than against it.
Key Chart Levels: Support and Resistance
Support and resistance levels are areas on a chart where price has historically had difficulty moving past. Support is a price level where buying interest tends to be strong enough to prevent the price from falling further. Resistance is a level where selling pressure tends to stop the price from rising higher.
These levels appear on charts as horizontal lines where price has reversed or paused multiple times in the past. The more times a level has been tested without being broken, the more significant it is considered to be. When price finally breaks through a strong support or resistance level, it can signal a significant shift in market sentiment.
Support and resistance are among the most widely used concepts in technical analysis. They can help you decide where to enter a trade, where to place a stop-loss order, and where to take profit. Combining these levels with your understanding of candlestick patterns and trends creates a much stronger basis for your trading decisions.
Using Timeframes Together
One technique many traders use is called multiple timeframe analysis. This involves looking at the same currency pair across different timeframes to get a fuller picture of market conditions. For example, you might use a daily chart to identify the overall trend direction, then switch to a one-hour chart to find a specific entry point that aligns with that bigger picture.
This approach helps you avoid taking trades that go against the dominant trend on a higher timeframe. It also helps you fine-tune your entries and exits more precisely. Developing the habit of checking multiple timeframes before placing a trade can significantly improve the quality of your analysis.
Reading charts effectively is a skill that develops with practice and repetition. The more time you spend studying real charts and observing how price behaves, the more natural it becomes.
Start Practising on a Free Demo Account
Understanding forex charts is just the beginning of your trading education, but it is an absolutely essential foundation. Every technical analysis tool and trading strategy you encounter will rely on your ability to read and interpret chart data accurately. The good news is that this is a skill anyone can learn with dedication and consistent practice.
The best way to build your chart-reading skills without any financial risk is to open a free demo account at ZenithFX.com. A demo account gives you access to real market data and professional charting tools, so you can practise identifying trends, spotting support and resistance levels, and reading candlestick patterns in a completely risk-free environment. Start your free demo today and take the first step toward trading with greater confidence and clarity.
🎓 Free Forex Education at ZenithFX
Access our full learning center — forex basics, advanced strategies, video tutorials, and live webinars. All completely free.
Leave a comment