What Is Technical Analysis? A Beginner’s Guide
If you’ve ever watched a price chart and wondered whether it could tell you something useful about where a currency pair might move next, you were already thinking like a technical analyst. Technical analysis is one of the most widely used approaches in forex trading, and for good reason — it gives traders a structured way to read the market using historical price data. Rather than focusing on economic news or interest rate decisions, technical analysis looks directly at price movements and patterns to help traders make more informed decisions. It’s a skill that takes time to develop, but the core ideas are accessible to anyone willing to learn.
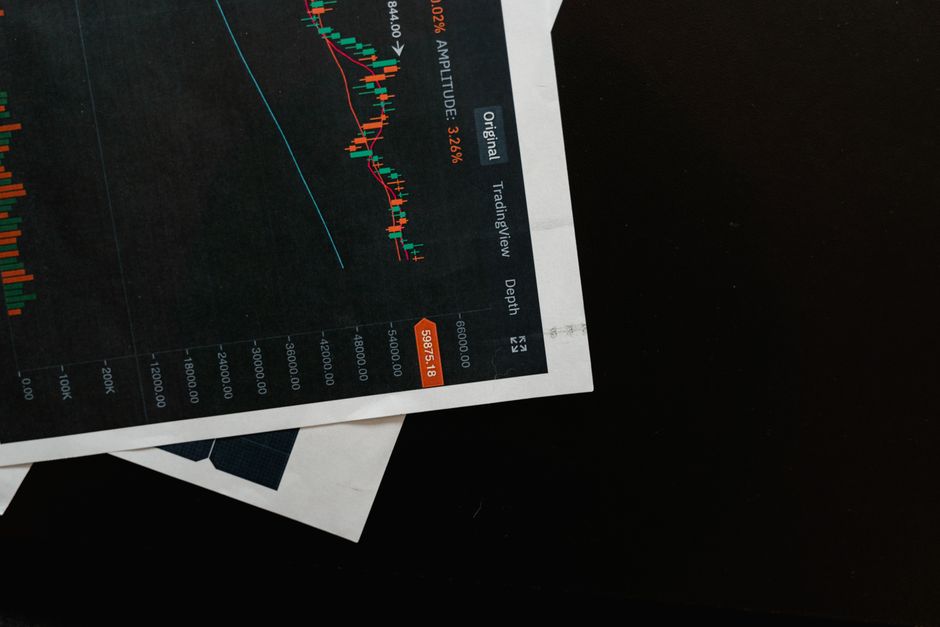
What Is Technical Analysis?
Technical analysis is the study of past price movements to help forecast future price behaviour. Traders who use this approach believe that all available information — economic data, news events, market sentiment — is already reflected in the current price. This idea is sometimes called the “price discounts everything” principle. Instead of digging into a country’s economic reports, a technical trader focuses on what the chart itself is showing.
The practice has deep roots in financial markets. Charles Dow, co-founder of the Wall Street Journal, developed many of the foundational ideas in the late 1800s that we now call Dow Theory. Over the following century, traders and researchers built on these ideas to create the wide range of tools and techniques used today. From simple trend lines to complex mathematical indicators, technical analysis has evolved into a comprehensive framework for understanding market behaviour.
It’s important to understand that technical analysis does not predict the future with certainty. No method can do that. What it does is help traders identify probabilities and patterns, giving them a logical basis for entering or exiting trades rather than acting on guesswork or emotion.
The Core Assumptions Behind Technical Analysis
Technical analysis rests on three core assumptions that guide how traders interpret charts. The first, as mentioned, is that price reflects everything. The second assumption is that prices move in trends. Markets don’t move randomly — they tend to move in a direction for a period of time before reversing or consolidating. Identifying the direction of a trend early is one of the key goals of technical analysis.
The third assumption is that history tends to repeat itself. Human psychology drives markets, and because people tend to react to similar situations in similar ways, price patterns that appeared in the past are likely to appear again. This is why chart patterns like the “head and shoulders” or “double top” are studied so carefully — they have appeared repeatedly across different markets and different time periods.
These three principles give technical analysis its foundation. While no framework is perfect, these assumptions provide a consistent and logical starting point for analysing any currency pair or financial market.
Key Tools Used in Technical Analysis
Technical traders use a wide variety of tools, but most beginners start with a few essential ones. Support and resistance levels are among the most important concepts. Support is a price level where buying interest tends to emerge, pushing prices back up. Resistance is a level where selling pressure tends to appear, pushing prices back down. Identifying these levels helps traders decide where to enter a trade, where to set a stop-loss, and where to take profit.
Trend lines are another fundamental tool. By drawing a line connecting a series of higher lows in an uptrend, or lower highs in a downtrend, traders can visually map the direction of the market. When price breaks through a trend line, it can signal a potential change in direction.
Beyond these basics, traders also use technical indicators — mathematical calculations applied to price data. Popular examples include Moving Averages, which smooth out price fluctuations to show the overall trend direction; the Relative Strength Index (RSI), which measures whether a market is potentially overbought or oversold; and the MACD, which helps identify momentum shifts. These indicators don’t give perfect signals, but they can add useful context when combined with other analysis.
Understanding Chart Patterns
Chart patterns are formations created by price movements on a chart. Traders study these shapes because they have historically been followed by specific types of price behaviour. There are two main categories: continuation patterns, which suggest the current trend is likely to continue, and reversal patterns, which suggest the trend may be about to change direction.
Common continuation patterns include flags, pennants, and triangles. These typically form when price pauses and consolidates after a strong move before continuing in the same direction. Reversal patterns include the head and shoulders, double tops, and double bottoms. Spotting these patterns on a live chart takes practice, but with time they become easier to recognise.
It’s worth remembering that no pattern works every single time. A double top might look textbook perfect but still fail to produce a reversal. This is why experienced traders always use risk management tools alongside their technical analysis, such as stop-loss orders that limit how much they can lose on any single trade.
Technical Analysis vs Fundamental Analysis
A common question among new traders is whether to use technical or fundamental analysis. Fundamental analysis involves studying economic data, central bank policies, inflation rates, employment figures, and other macroeconomic factors to determine whether a currency is likely to strengthen or weaken over time. It’s a powerful approach, particularly for longer-term trading decisions.
Technical analysis, by contrast, works across any time frame — from a one-minute chart to a monthly chart — making it particularly popular among short-term traders and day traders. Many experienced traders choose to use both approaches together, using fundamental analysis to understand the bigger picture and technical analysis to find precise entry and exit points.
Neither approach is superior to the other. The best choice depends on your trading style, time availability, and personal preference. Many beginners find technical analysis easier to get started with because the rules are visual and concrete, rather than requiring deep knowledge of global economics.
How to Start Practising Technical Analysis
The best way to develop technical analysis skills is through consistent practice with real charts. Start by studying one or two tools at a time rather than trying to learn everything at once. Spend time drawing support and resistance levels on historical charts, or observe how a moving average behaves across different market conditions. Keep a trading journal to record your observations and review what worked and what didn’t.
Using a demo account is one of the most effective ways to practise without putting real money at risk. A demo account gives you access to live market conditions and real charting tools, so you can apply technical analysis in a realistic environment. ZenithFX.com offers a free demo account with full access to professional charting features, making it an ideal place to build your skills from the ground up.
Consistency is more important than complexity. Many successful traders rely on a small number of simple tools applied with discipline, rather than overloading their charts with dozens of indicators. Focus on understanding the basics thoroughly before adding more complexity to your analysis.
Conclusion
Technical analysis is a powerful and practical framework for understanding forex markets. By studying price charts, identifying trends, and recognising patterns, traders can develop a more structured and disciplined approach to making trading decisions. It won’t eliminate risk or guarantee profits — nothing can — but it gives you a logical, evidence-based method for navigating the market rather than relying on gut feeling alone.
If you’re ready to put these ideas into practice, the best next step is to open a free demo account at ZenithFX.com. You’ll get access to professional charting tools, real market data, and a risk-free environment where you can begin applying everything you’ve learned. Start exploring the charts today — your journey as a more informed trader begins right here.
🎓 Free Forex Education at ZenithFX
Access our full learning center — forex basics, advanced strategies, video tutorials, and live webinars. All completely free.
Leave a comment