
Candlestick vs Bar Chart: Which Is Better for Trading?
When you first open a trading platform, one of the earliest decisions you face is choosing how to display price data on your chart. Two of the most popular options are candlestick charts and bar charts. Both show the same core information — the open, high, low, and close price for each time period — but they present it in very different ways. Understanding the strengths and weaknesses of each can help you make better trading decisions and develop a charting style that suits your personality and strategy.
How Candlestick Charts Work
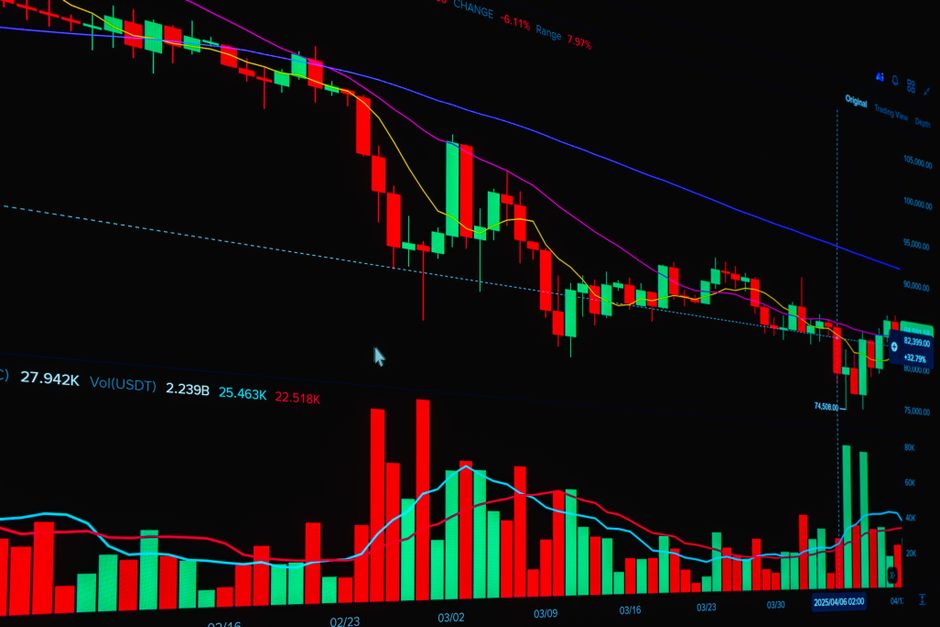
Candlestick charts originated in Japan and have been used to track rice prices since the 18th century. Each candlestick represents a single time period, whether that is one minute, one hour, or one day. The body of the candle shows the distance between the opening and closing price. If the close is higher than the open, the body is typically displayed in green or white, indicating bullish price action. If the close is lower than the open, the body appears in red or black, signaling bearish movement.
The thin lines extending above and below the body are called wicks or shadows. The upper wick shows how high the price reached during that period, while the lower wick shows how low it fell. This combination of body and wicks gives traders a visual snapshot of the battle between buyers and sellers during any given period. The thicker body of the candlestick makes it easy to see at a glance whether bulls or bears were in control.
One of the most powerful aspects of candlestick charts is the library of named patterns that traders have developed over centuries. Patterns like the doji, hammer, engulfing candle, and morning star give traders specific signals to watch for. These patterns are widely taught and studied, making them a common language among traders around the world.
How Bar Charts Work
Bar charts, sometimes called OHLC charts, display the same four data points as candlesticks — open, high, low, and close — but in a different visual format. Each bar is a vertical line, with the top representing the session high and the bottom representing the session low. A small horizontal tick on the left side of the bar marks the opening price, while a small horizontal tick on the right side marks the closing price.
Because bar charts do not have a filled body, they can appear more compact and less visually dominant on a chart. Some traders find this makes it easier to focus on price levels and overall market structure without being distracted by the color-coded bodies of candlesticks. Bar charts have been a staple of Western technical analysis for decades and remain popular among a dedicated group of traders.
Bar charts are particularly useful when you want to see precise price levels at a glance. The left and right ticks make the open and close easy to identify once you are familiar with the format. However, for newer traders, the bar chart can take longer to read quickly, especially when analyzing fast-moving markets where every second counts.
Key Differences at a Glance
Although both chart types display the same data, the experience of reading them is quite different. Here is a quick summary of how they compare:
- Visual clarity: Candlesticks use filled bodies and color coding, making bullish and bearish periods immediately obvious. Bar charts require more practice to read at speed.
- Pattern recognition: Candlestick patterns are more widely documented and taught. Bar charts have their own patterns, but the library is smaller and less universally known.
- Screen space: Bar charts can appear cleaner and less cluttered on smaller screens or when viewing many time frames at once.
- Tradition: Candlesticks are rooted in Eastern trading tradition, while bar charts come from Western technical analysis.
- Learning curve: Most beginners find candlestick charts easier to understand quickly due to their intuitive color coding.
Neither format gives you additional market data that the other withholds. The underlying price information is identical. The real difference lies in how that information is communicated to your brain and how quickly you can act on what you see.
Which Chart Type Do Professional Traders Use?
The honest answer is that professional traders use both, and their preference often comes down to personal experience and trading style. Many retail traders and institutional analysts favor candlestick charts because pattern recognition is a core part of their strategy. The visual weight of the candlestick body makes it faster to scan a chart and identify key moments of buying or selling pressure.
That said, a meaningful number of professional traders, particularly those using systematic or rules-based approaches, prefer bar charts. They argue that the bar format keeps the focus on price action without the visual noise that can sometimes come from large, colorful candlestick bodies. Some traders even find that switching between chart types occasionally helps them see the market with fresh eyes.
The most important takeaway is that your chart type is a tool, not a strategy. A well-defined trading plan, solid risk management, and consistent execution matter far more than whether you prefer bars or candles. Successful traders exist in both camps, and the best chart type for you is the one that you can read clearly and act on confidently.
Factors to Consider When Choosing
When deciding which chart type to use, think about your trading style and what kind of analysis you rely on most. If you use technical patterns as entry signals, candlestick charts are likely the better fit. The vast amount of educational material available on candlestick patterns means you will never run short of resources to sharpen your skills.
If you prefer a cleaner, less color-heavy display and focus more on drawing support and resistance levels, trend lines, or using indicators, a bar chart might actually suit your workflow better. Some traders who use multiple monitors or track many currency pairs at once also prefer bar charts because they take up less visual space.
Consider also your trading timeframe. Scalpers working on one-minute or five-minute charts often gravitate toward candlestick charts because individual candle patterns can provide fast signals. Swing traders and position traders working on daily or weekly charts may find that either format works equally well, since they have more time to analyze each bar before making a decision.
Practicing with Both Chart Types
The best way to find your preference is simply to use both. Spend time studying charts in each format and pay attention to how quickly and comfortably you can read price action. You may find that one format clicks immediately, or you may develop a genuine appreciation for both depending on the situation.
A demo account is the ideal environment for this kind of experimentation. You can switch between candlestick and bar charts freely, test different strategies, and observe how each display affects your decision-making — all without risking real money. Platforms like ZenithFX.com allow you to explore both chart types alongside a full set of technical tools, making it easy to compare formats side by side in real market conditions.
Take your time with this process. Many traders spend weeks or months getting comfortable with chart reading before they trade live. The goal is to build genuine confidence in what you see on the screen and how you respond to it. Rushing that process rarely ends well.
Conclusion
Candlestick and bar charts both have legitimate places in technical analysis, and neither is objectively superior to the other. Candlestick charts win points for visual clarity, intuitive color coding, and a rich library of recognized patterns. Bar charts offer a cleaner, more compact display that some traders find easier to work with at a strategic level. The right choice depends on your trading style, your analysis method, and ultimately what helps you make clearer decisions under pressure.
The single best step you can take right now is to start exploring both formats in a risk-free environment. Open a free demo account at ZenithFX.com today and spend time reading live charts in both candlestick and bar format. Practice identifying patterns, marking key levels, and developing your eye for price action. Building that foundation now will make you a more prepared and confident trader when you are ready to step into the live markets.
Ready to Start Trading?
✓ Free demo account — no deposit needed
✓ MT4, MT5, WebTrader and Mobile
✓ Real-time charts and live prices
✓ Switch to live account when you are ready
Leave a comment